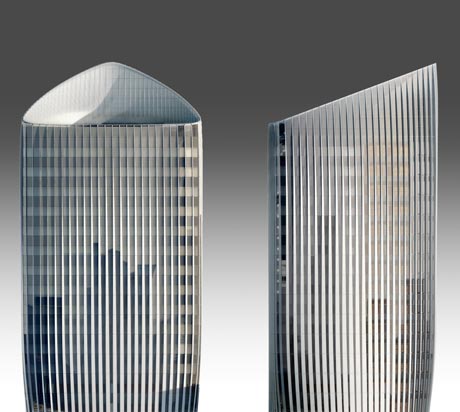
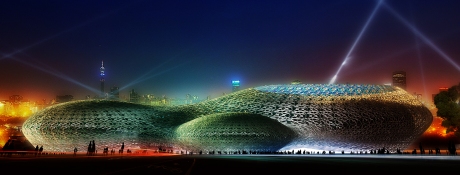
Back in early August, I had the privilege of speaking at USC’s annual BIM Symposium on the topic of visual programming. This post is my attempt at a sort of editorial that follows the narrative of that talk. Along the way, I’ll include a few of the videos that I shared at the presentation which hopefully demonstrate the kind of tool creation I’m talking about. Hope you enjoy.

It’s been 5 years since we officially launched our research program at the Yazdani Studio of Cannon Design. During that period we’ve come to understand that the evolution of our process reflects the larger, changing relationship architects have with their means of production. We’ve always been a profession of hackers. Every building is a one-off made up of countless elegant hacks, each bringing disparate materials and systems together into a cohesive whole.  But when it comes to the software that designers have come to rely on, most of us have been content with enthusiastic consumerism, eagerly awaiting the next releases from software developers like Autodesk, McNeel and Bentley. In late 2007 something changed. McNeel introduced a visual programming plugin called Grasshopper authored by David Rutten, and more and more architects began to hack their tools as well as their buildings. Read the rest of this entry »

SRad-Elev-grey

About a year ago I was asked to speak at the University of Oregon’s annual H.O.P.E.S. conference and lead a workshop demonstrating the computational approach to design we promote on this blog and at the Yazdani Studio. The workshop focused on the optimization tools we have been piecing together using Grasshopper for Rhino and its many add ons. Today we’re going to share an updated version of the Gh definition used in the workshop. A video that breaks down the definition and various steps involved is also included below. The goal here is to share a general framework for creating optimization tools with Grasshopper. My hope is that the script below, along with breakdown video, might be a useful guide for anyone interested in developing their own optimizations or tailoring them to specific situations. In the example provided, the definition is used to optimize a building form to receive the minimum possible total solar radiation given only the geographical location, building area, and number of floors.

Read the rest of this entry »

It’s been several years now since the Galapagos component was included in Grasshopper for Rhino. Back in 2011 Charles Aweida wrote a blog post that included a proof of concept in which he used this tool to optimize a simple multi-sided form to receive the lowest amount of heat energy from the sun. Since then, we’ve been trying to create optimization tools at the building scale that can inform our decision making process during design. The videos below are optimizations for heat gain and views on a site in Boston, MA. We are actively looking for ways to expand this list to include a wider range of project / site specific design drivers such as daylighting, structure, and wind.

………………………………………………………………………………………

Read the rest of this entry »

Part one of this article discussed facade design and environmental analysis. In the second half, we focus on system rationalization and conceptual cost estimating. A more detailed description of real-time scheduling, tagging, and rationalization using Grasshopper for Rhino is also covered.

Read the rest of this entry »
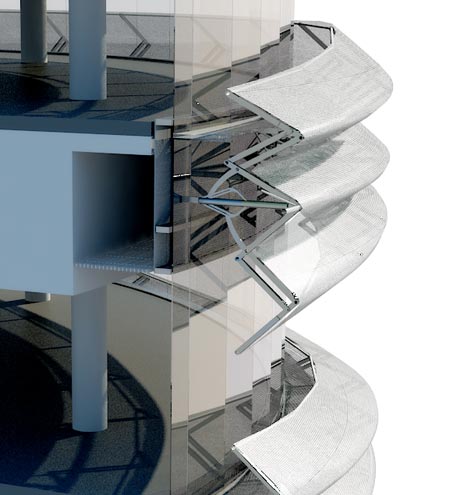
elev-detail1-bk-sml

This past fall, the Yazdani Studio, along with Gruen Associates and builders Hensel Phelps participated in an invited competition to design a new US Courthouse in the heart of downtown Los Angeles. The site for the project is located at the intersection of Broadway and 1st, one block West of the LA times building and a few blocks east of the Walt Disney Concert Hall. Read the rest of this entry »
LACH_RADandDL

Last fall a custom data visualization developed by our research team was featured on the information is beautiful website as part of their information is beautiful awards. In this post we discuss why we developed the graphic and how it is used.

Incident Solar Radiation is one of the most common types of analysis performed by architects at the conceptual design stage. Results indicate where solar heat gain might be an issue. These are areas where glazing should be minimized and exterior sunshades should be considered. Unfortunately, Ecotect does not have a way of communicating all of the results of this analysis in a single concise graphic format. As part of the research effort, we have developed a grasshopper definition that generates a graphic representation of both heat intensity and panel orientation in a single frame. Read the rest of this entry »

This post is a continuation of post 1 exploring panelizing techniques for a stadium design concept. This body of work pertains mostly to the development of both curved and faceted panels influenced by weather/analysis data, the development of rationalized geometric configurations, the algorithmic documentation of this system and lastly to answer the question; if every point on a building is unique can a building’s performance and comfort can be optimized by tuning each panel on a faced to its unique position/orientation?

Read the rest of this entry »


Developing the kinetic facade on the CJ R&D Center  presented some unique technical challenges in terms of visualizing a range of motion for a mechanical assembly of parts. As architectural designers, we’re accustomed to working with static elements. CJ called for new methodologies that would enable us to easily manipulate hierarchical structures of linked components, allowing us to visualize how a modification to one part would effect the whole system.   To do this, we used a combination of tools (inverse kinematics, wire parameters and animation constraints) originally intended for use in character animation within 3ds Max . Read the rest of this entry »

CJ FACADEAs part of a recent design effort here in the studio we attempted to develop a kinetic facade that could respond and adapt in real-time to both solar radiation and user input. The client, CJ Corporation of Korea, was enthusiastic about the idea as part of their “only one” initiative which promotes unique one-of-a-kind thinking. While this certainly isn’t the only kinetic facade in the world, it presented our team with a new set of challenges.

[vimeo http://vimeo.com/19900510 w=460&h=259] Read the rest of this entry »

For many of us, the holy grail of modeling surface detail is the ability to “paint” geometry directly onto a surface in 3d space – being able to generate complex effects, or influence subtle variation with the stroke of the mouse or stylus. Tools such as Mudbox and Zbrush already support this exact mode of working, however combining geometry painting with the parametrics of 3ds Max to achieve responsive panel behavior would be a “best of both worlds” scenario. We’ll test this concept in the video below. Using the new viewport canvas tool in combination with the displacement modifier, we’ll attempt to build and manipulate surface effects similar to the embossed pattern on Zaha Hadid’s footware for Lacoste.

Read the rest of this entry »
The possibility of controlling panels in a Revit curtain wall through an Excel spreadsheet opens up a wide range of opportunities for interoperability between Revit and other tools in our workflow. Any program capable  of exporting a range of values could potentially send values directly to Revit, saving users the hours of manual data entry currently required to translate a design or analysis  model into a documentation (BIM) model.   To enable Revit to read in values from Excel , we looked at two Revit plugins; Revit Excel Link ,developed by Cad Technology Center and Whitefeet, written by Mario Guttman. Using a combination of Revit and both plugins, we were able to develop the workflow demonstrated in the video below.

Read the rest of this entry »
Project Vasari, a standalone application that expands on the Revit conceptual mass family interface (available here from Autodesk Labs) brings Ecotect analysis capabilities into the Revit environment.  We test drove this tool to see if we could create a surface that responds directly to the results of solar analysis. Vasari allows us to easily export analysis data in .CSV format, bring that information into Excel and read all the values generated from Solar Analysis. Having that numerical data available, we initially thought we could bring these values back into Revit to drive a specified parameter in the Pattern-based Curtain Panel family. Unfortunately, we discovered, that data exported from Vasari’s Solar Analysis does not always correspond with the position of curtain panels within the curtain wall. That is, data point 1, 2, 3… does not correspond to panel 1, 2, 3…etc.  In our experiments , the logic of how the .CSV data is organized has nothing to do with the row / column organization in a divided surface grid.  Without the help of a custom plugin that could perform automatic labeling of curtain panels based on position, using CSV data would require a user to manually enter a numerical value or label  panel by panel.

As a workaround, we used a tool that translates pixel color from an image into values that affect instance parameters within a Revit family.  By feeding in graphical results from Vasari’s Solar Analysis, we were able to achieve the desired effect.   This tool, known as the Bitmap to Panel plugin, can be downloaded from Zach Kron’s blog, Buildz: http://buildz.blogspot.com/2010/08/making-revit-forms-from-image-files-in.html . It works by translating grayscale image values int0 numerical data, which is then inserted into a specified parameter within the Revit curtain panel family.

Read the rest of this entry »

Many of us have struggled with incorporating analysis data from energy consultants or software like Ecotect and Energy Plus into the the early stages of design. This is largely due to the cumbersome process of moving models between design and analysis software, or worse,  the necessity to completely rebuild a model to suit a particular type of analysis or tool.  To complicate things further, the result of such efforts isn’t easily incorporated back into the design process, because the data harvested is usually output in a static format such as a chart or two-dimensional graphic.  A large part of our research is focused on discovering methods of improving the design/ analysis workflow so that that analytic tools can inform decisions made in the early stages of design. In this post we demonstrate a workflow for moving  3d geometry from our design tool, 3DStudio Max  through Rhino/ Grasshopper, into our analysis tool, Ecotect. After gathering data, we import a 3-dimensional representation of that information back into Max to help shape the design.  This process is also compatible for use with Maya or any other 3d modeling tool that can work with vertex colors (known as false color in Rhino) such as Blender or Unity.

Read the rest of this entry »

Evolutionary problem solving mimics the theory of evolution employing the same trial-and-error methods that nature uses in order to arrive at an optimized result.  When automated for specific parameters and results, this technique becomes an effective way to computationally drive controlled results within the iterative design process – allowing designers to produce optimized parameters resulting in a form, graphic or piece of data that best meets design criteria. In this post we walk you through the process of using Galapagos, an evolutionary solver for Rhino/ Grasshopper, and show an example of how this method can be tied in with analysis tools to optimize form based on energy data.

Read the rest of this entry »

I had the pleasure of exploring stadium concepts for a potential project in Saudi Arabia. The stadium typology has much to offer on the subject of skin, response and computational design with its sheer size and volume of components. One avenue explore was a loop consisting of  analysis data generated by Ecotect and a design concept formulated  in Rhino3d. Extracting data from Ecotect is quite simple. A .txt file with data in the CSV format can be exported from Ecotect through the following location: Display->Object Attribute Values->Properties->Export Data… This data is saved as a .txt file and can be directly imported into grasshopper with the ‘read file’ GH component. Although the information is accurately imported there is a break in the loop which forces one to stop, export and re-import the information. Luckily Ecotect creates a Dynamic Data Exchange server which allows running applications to speak with each other. The GecoGH plugin is a great set of tools that executes this exchange in a seamless loop where the scripted geometry/design is streamed to and from Ecotect. Below you will see some screen shots of a process utilizing this functionality.

GH mesh geometry

Read the rest of this entry »

Part 3 has an identical flow of data to part 2, the only difference is the type of sensor and the 3-dimensional relationships it effects. In this example we use a PING))) Ultrasonic Sensor to measure the proximity of an object (in this case my hand) to the sensor.  The ultrasonic range finder works by sending out a burst of ultrasound and listening for the echo as it reflects off an object. Code written to the Arduino board sends a short pulse to trigger the detection, then listens for a pulse on the same pin using the pulseIn() function. The duration of this second pulse is equal to the time taken by the ultrasound to travel to the object and back to the sensor. Using the speed of sound, this time can be converted to distance. For more information on the code and circuit click here.

The code written by Arduino prints values in “in” and “cm”. In this example we only need one value so we will use Serial.println(cm) and comment out the other Serial.print() functions. This will send a single array of values through the serial port similar to the example in our previous post. In Rhino the aperture is built by crating a circular array of pivot points about a center axis. These pivot points rotate a series of overlapping blades controlled by a singe parameter.

The values streaming from the serial port are fed directly into the grasshopper build driving the rotation of blades. To see this process in action see the video below. Notice the values printed to the ‘right’ screen displaying the distance in centimeters.

See the video in HD here.

In our previous post making things that talk part 1 the analogy is used where a group of people communicate allowing them to share and transfer information. In this post we build on the same concept with the micro controller (Carl) and the sensor (Susan). There are two changes; (Paul) from processing has left us and is replaced with (Grant) from grasshopper and the source (Sam) is still here but he is measuring wind variance vs light. In this example we use a really interesting anemometer/wind sensor from modern device. This little sensor uses a technique called “hot wire” which involves heating an element to a constant temperature and measuring the electrical power that is required to maintain the heated element at temperature as the wind changes. With wind variance the sensor produces voltage/values. These values are sent through the serial port into grasshopper via the generic serial read component from firefly. Once the values are pipped into grasshopper they alter a series of relationships that inflates a 3-dimensional balloon.

The single array of data streaming from the sensor controls 4 relationships.

  • a. varying division points spaced along central axis
  • b. varying circle radius about the division points
  • c. mesh surface constructed from control curves
  • d. z axis translation based on radius

GHX build

Final build showcases the digital inflation of a balloon translated by a wind sensor.

See this video in HD here.

Our previous post thoughts on response and interaction mentions the idea of embedded systems and the process of physically making things talk. Our first example uses an Arduino micro-controller , ambient light sensor the Processing programming language/development environment and a source of data which in this case is light. This communication involves 4 participants with the micro controller acting as the manager directing all parties involved. To make things simple I will make up names for each piece of technology used. We will call the micro controller (Carl) the sensor (Susan), the Processing IDE (Paul) and the light source (Sam). We will assume that each person speaks a few languages, in reality this communication takes place via programming syntax.

The dialog goes as so:

  1. Carl the controller goes to Susan the sensor located at room (A0), he asks Susan to get data from Sam the source.
  2. Once Susan the sensor has the requested data she sends it back to Carol the controller.
  3. Carl the controller then takes the data and sends it to Paul from Processing.
  4. Paul is very artistic and draws the data on the screen.

Carl is quite demanding looping through this sequence over and over again…

Ambient light data

Ambient light data display via Processing and Arduino

In reality the process goes something like this:

  1. Code is written to the Arduino micro controller asking for the anolog input voltage streaming from pin (A0).
  2. The sensor plugged into pin (A0) captures the numeric values of light in the form of voltage ranging from 0 to 1023.
  3. The Code written to the Arduino micro controller grabs those values and sends them through the serial port.
  4. The Processing code catches the values from the serial port and draws vertical lines based on the values, which in turn gives us a graphic representation of light

As we build on this example take note to the fact that the general story stays the same, we swap out a few different characters, a few different roles, a few different languages but at the end of the day its still a group of ‘people’ ‘talking’ and relaying information.

Interaction is often defined as a type of action that occurs as two or more objects have an effect upon one another.  When people interact with each other the progression is an iterative loop of speaking, listening and processing. This phenomenon is ubiquitous taking place in many forms within our environment. Smart-phones, cars, software and the World Wide Web are all things we interact with daily. As technology continues to advance, these interactions have become a woven and integral part to the way we live.

Most of us have already designed our own digitally interactive relationships using parametric modeling software such as Revit (family parameter), MAX (modifier stack), Rhino (grasshopper logic) and CATIA (component object model)

Revit (family parameter)  MAX (modifier stack)  Rhino (grasshopper logic)  CATIA (component object model)

Revit, 3dsMAX, Rhino and CATIA's parametric software user interface

Designers use software to interact with a modeled space or geometry and its parameters in a continuous loop until the desired outcome or design is reached. This dynamic level of interaction is becoming more and more vital in practice, but remains predominantly digital and process-based:  its primary focus based on managing the design process and making it more flexible.  The flexibility and interaction expire once the design is set and the model is finalized and materialized in construction documents.

In an effort to create responsive buildings (rather than merely responsive models) we seek to pull this notion of flexible interaction from the realm of digital design into the physical world we design for.  Understanding these fundamental relationships of interaction and communication is key to realizing the potential buildings have to respond to their users, environment, function, etc.  As a first step towards realizing these potentials, our next few blog posts explore  the concept of embedded computation or embedded systems and how they cant can contribute to responsive building skins.

This article is dedicated to buildings that incorporate adjustable/ movable  technologies that can adapt to variations in climate and the position of the sun.

Jean Nouvel’s Arab Institute completed in 1987 is among the first buildings to employ sensor-based automated response to environmental conditions.  25,000 photoelectric cells similar to a camera lens are controlled via central computer to moderate light levels on the south facade (1).  Now famously frozen in place, the apertures are commonly referenced in cautionary tails used to warn designers of the perils of developing kinetic facades.

Read the rest of this entry »